Beyond Story Games: Unexpected Questas Use Cases in Research, Journalism, and Civic Design


Interactive, branching stories aren’t just for entertainment anymore.
Researchers, journalists, and civic designers are quietly adopting tools like Questas to do something deeper than “tell a cool story”: they’re using playable narratives to test assumptions, surface lived experience, and let people explore complex systems through choice, not just charts.
This shift matters because:
- Complex issues rarely follow a straight line. Policy trade‑offs, research insights, and civic decisions all involve branching “what if?” paths.
- People learn and reveal more through behavior than through surveys. Watching the choices someone makes in a scenario often tells you more than what they say on a form.
- AI visuals make abstract systems tangible. When participants can see the world they’re influencing, it’s easier to feel the stakes.
Questas sits right at this intersection: a visual, no‑code editor for building branching, choose‑your‑own‑adventure experiences with AI‑generated images and video. What started as a story game platform is becoming a quiet workhorse for applied research, explanatory journalism, and participatory civic design.
This post explores how—and gives you concrete patterns you can adapt.
Why “Playable” Beats “Readable” for Complex Work
Before we dive into specific domains, it’s worth naming why turning something into a playable scenario is so powerful.
1. Branches match real uncertainty
Linear decks and reports pretend the world is neat. But real questions look more like:
- What if this assumption is wrong?
- What if this group reacts differently?
- What if we prioritize X over Y?
Branching narratives let you encode those uncertainties directly into the experience. Instead of footnotes, you get forks.
If you’re curious how this looks in a research context, check out how we turn static decks into interactive explorations in Playable Research Reports: Turning Market Insights into Interactive Questas Story Decks.
2. Choices reveal priorities
When someone plays through a scenario built on Questas, you can see:
- Which paths they gravitate toward
- Where they backtrack or hesitate
- Which trade‑offs they accept or reject
Those patterns become qualitative and quantitative signals you can’t get from a traditional slide deck.
3. Visuals anchor emotion and memory
AI‑generated images and micro‑video can:
- Humanize abstract personas
- Make invisible systems visible (budgets, timelines, power structures)
- Carry tone—hopeful, tense, bureaucratic, urgent—in a single frame
If you want to go deeper on visual systems, Prompt Libraries That Scale: Building Reusable AI Image Systems for Long-Running Questas Series walks through how to keep worlds coherent across dozens of branches.
Research: From Static Findings to Playable Experiments
Researchers—UX, market, academic, policy—are increasingly under pressure to do more than “deliver a report.” Stakeholders want to feel the implications of the work and explore alternatives, not just skim a summary.
Interactive scenarios built in Questas can turn research into a living experiment.
Three research patterns you can steal
1. Playable personas and journeys
Instead of a persona PDF, you build a branching narrative where the player becomes the user:
- They choose how to respond to constraints
- They navigate realistic obstacles
- They experience the consequences of design or policy decisions
This approach pairs especially well with the ideas in Designing ‘Playable Personas’: Using Questas to Let Teams Step Into Their Users’ Shoes.
How to build it in Questas:
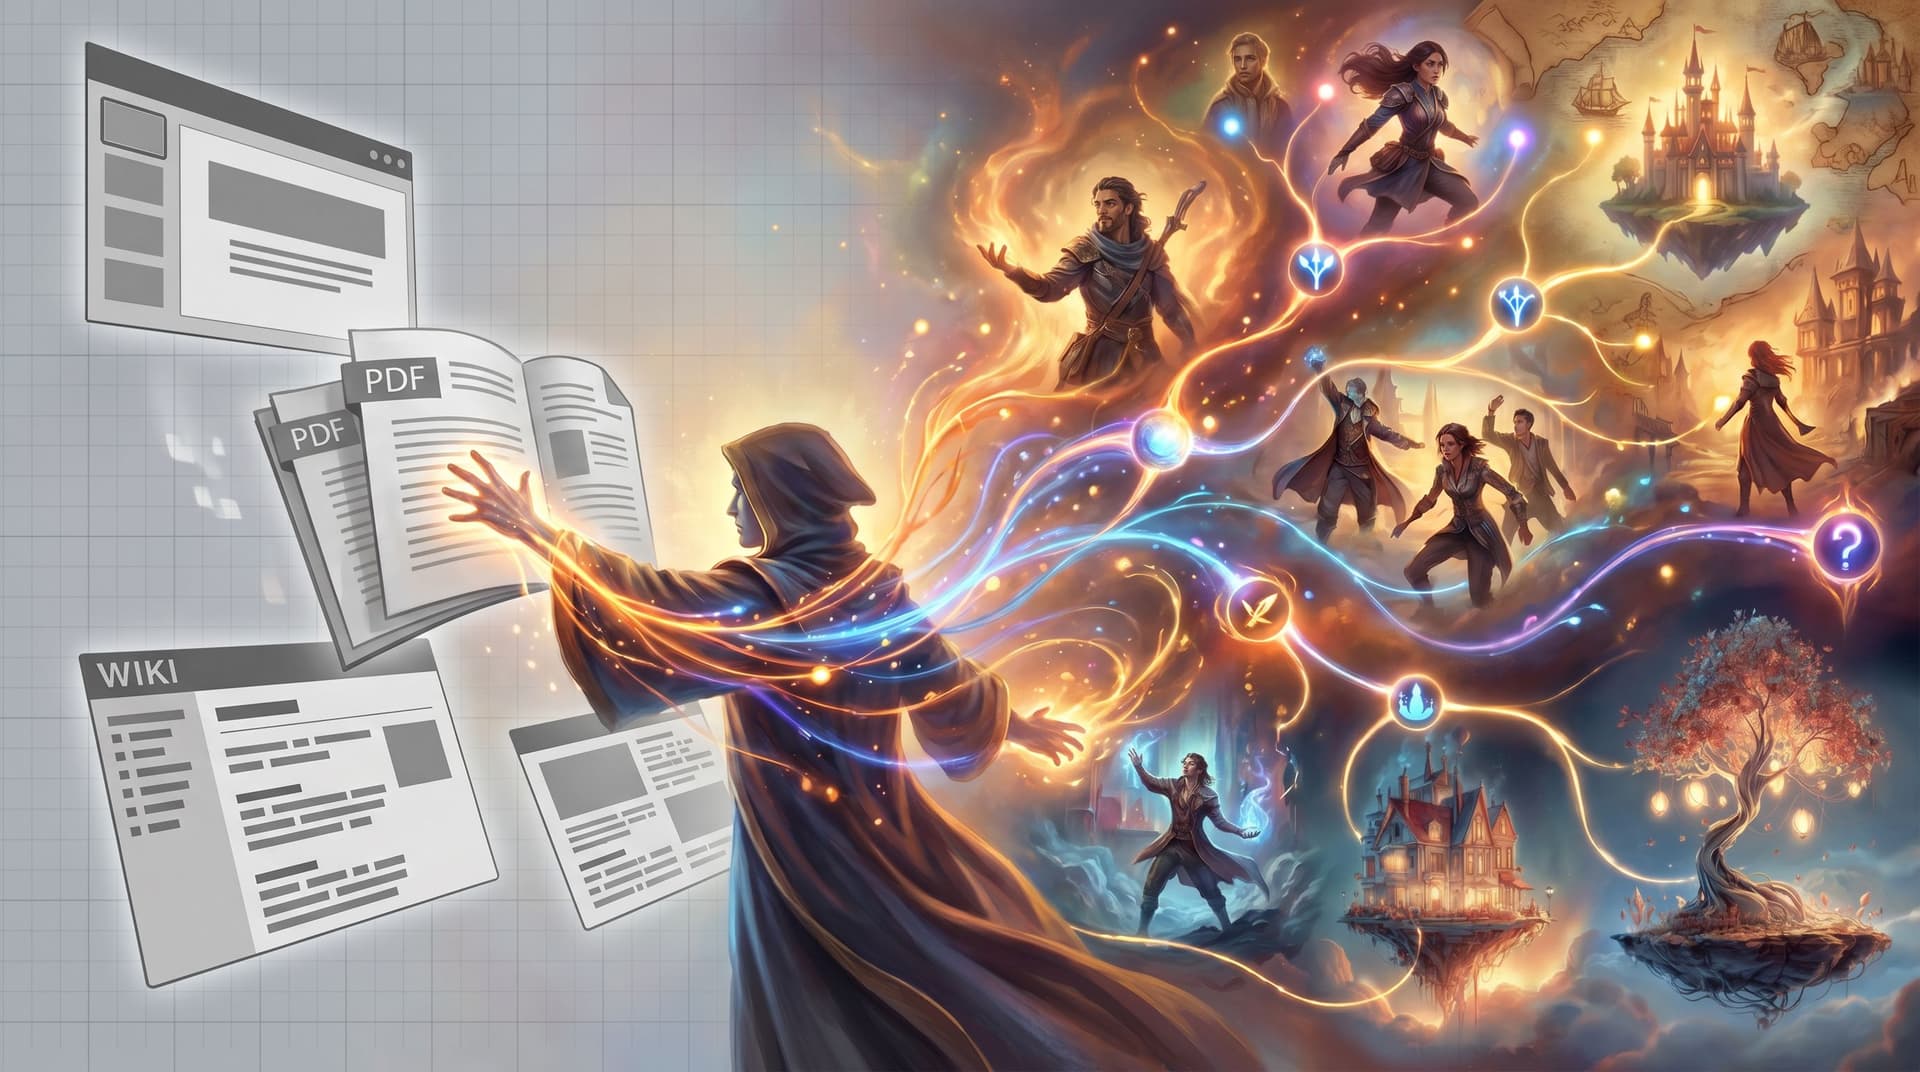
- Start from your existing materials. Import key slides, interview quotes, or journey maps as reference. If you’re already sitting on decks and PDFs, you can also adapt the workflow from The Visual Remix: Using Questas to Turn Existing Slide Decks, PDFs, and Wikis into AI-Illustrated Story Hubs.
- Define 3–5 pivotal decision points in the user’s journey (e.g., onboarding, upgrade moment, support failure, churn decision).
- Write each decision as a grounded choice, not a survey question, e.g.:
- “You’re late for work and the app crashes. Do you…?”
- Map 2–3 branches from each decision that reflect realistic outcomes, not just “good/bad.”
- Use AI images to humanize scenes—consistent character, environment, and UI mockups.
What you get: a reusable, replayable artifact that trains empathy and reveals where stakeholders still misunderstand the user.
2. Branching concept tests
Instead of asking, “Which concept do you prefer?” you let people live with each concept in a short scenario.
Example: testing subscription models.
- Path A: low monthly fee, strict limits
- Path B: higher monthly fee, generous limits
- Path C: pay‑as‑you‑go with unpredictable costs
In Questas:
- Each path becomes a short storyline with 3–4 scenes showing how the model affects everyday use.
- AI visuals show invoices, dashboards, and emotional moments (surprise bill vs. pleasant savings).
- You track which paths people choose and where they drop off.
This turns a dry pricing exercise into a behavioral study.
3. Playable research readouts
You can also flip your own findings into a quest for stakeholders:
- Scene 1: Set up a real user situation.
- At each branch, the stakeholder chooses a decision they think the user would make.
- The next scene reveals what actually happened in the research, with quotes and visuals.
This structure:
- Makes misaligned assumptions painfully visible
- Forces teams to confront edge cases instead of ignoring them
- Turns your report into a conversation starter, not a file to archive

Journalism: From Explanatory Articles to Playable Explainers
Journalists have been experimenting with interactive formats for years: scrollytelling, data visualizations, and choose‑your‑own‑path features about climate, policing, and elections.
Tools like Questas lower the bar for this kind of work. You don’t need a newsroom dev team to produce a playable explainer.
Where branching journalism shines
1. Policy and systems explainers
Think:
- Housing policy and zoning decisions
- Criminal justice reform
- Healthcare coverage trade‑offs
Instead of a single narrative, you build a scenario where the reader plays as:
- A council member voting on a bill
- A tenant navigating a new regulation
- A small business owner responding to rule changes
At each choice, they see consequences unfold for different groups, illustrated with AI‑generated scenes and infographics.
2. Long‑running investigations
For complex investigations—supply chains, corruption networks, environmental disasters—you can:
- Let readers follow different actors (whistleblower, regulator, company, community member)
- Reveal sources and evidence as “discoveries” along each path
- Use branching to show how certain decisions led to specific outcomes
3. Historical counterfactuals
You can also use Questas to explore “what might have happened” scenarios grounded in historical research:
- Alternative treaty outcomes
- Different responses to early warnings
- Unchosen policy options
These aren’t predictions—they’re structured thought experiments that help audiences understand contingency and agency.
Building a playable explainer step‑by‑step
-
Clarify the learning goal.
What should the reader understand or feel by the end? For example:- “How a zoning change affects renters vs. homeowners.”
- “Why a supply chain is so hard to unwind.”
-
Pick a single point of view.
First‑person POV (“you are…”) is often the most engaging:- “You’re a newly elected city council member…”
-
Outline 3–4 key decision points.
Each should:- Reflect a real decision someone in this role faces
- Have at least two plausible options
- Lead to clearly different consequences
-
Ground every branch in reporting.
Use your interviews, data, and documents to:- Inform the options available
- Shape the outcomes and side effects
- Provide quotes or stats inside scenes as “evidence”
-
Use AI visuals to compress context.
For each scene, generate images that:- Show who is affected (faces, environments)
- Convey mood (tension in a hearing, quiet anxiety at a kitchen table)
- Highlight key artifacts (ballots, notices, maps)
-
End with reflection, not a quiz.
After the final branch, invite the reader to compare:- What they chose vs. what real decision‑makers did
- Who benefited and who was harmed
- What trade‑offs they’d reconsider
The result: an explainer that feels less like a lecture and more like a guided experience through the system.
Civic Design: Letting Communities Play Through Futures
Civic design and public participation often struggle with the same problems:
- Residents feel decisions are opaque and predetermined.
- Public meetings privilege people who are loud, available, and comfortable speaking on record.
- Trade‑offs are described in abstract terms instead of lived consequences.
Branching narratives built in Questas give cities, nonprofits, and community groups a way to invite broader, deeper participation.
Use case 1: Participatory budgeting simulations
Instead of asking residents to rank priorities on a survey, you can:
- Put them in the role of a budget committee member.
- Show them a starting budget, constraints, and competing demands.
- Let them allocate funds across categories—parks, transit, housing, public safety.
Each choice leads to scenes that show:
- Who benefits and who loses out
- Short‑term vs. long‑term consequences
- Unintended side effects (e.g., maintenance costs, displacement)
AI‑generated visuals make these impacts tangible: a renovated playground, a bus line cut at night, a shelter expansion that never gets built.
Use case 2: Urban planning “walkthroughs”
For zoning changes, new developments, or street redesigns, you can create:
- A first‑person “walk” through the neighborhood under different scenarios
- Branches that reflect different design options (bike lanes vs. parking, density levels, green space choices)
- Perspectives from multiple roles: resident, business owner, commuter, visitor
Residents can:
- Explore paths at their own pace on phones or kiosks
- Leave qualitative feedback at key decision points
- Replay with different choices to understand trade‑offs
Use case 3: Policy “stress tests” with stakeholders
Before launching a new policy, invite frontline workers, advocacy groups, and affected communities to stress‑test it in a quest:
- They play through realistic edge cases.
- They identify failure modes and loopholes.
- They propose alternative branches that better reflect lived experience.
You can then:
- Iterate the policy and the quest in parallel.
- Use the updated quest as a training and onboarding tool later.

Practical Design Tips for Non-Game Creators
If you’re a researcher, journalist, or civic designer, you might be thinking: This sounds great, but I’m not a game designer. Good news: you don’t need to be.
Here are practical patterns to keep your first builds manageable.
Start smaller than you think
- Aim for 10–20 scenes, not 100.
- Limit yourself to 3–4 major decision points. Each can branch into 2–3 outcomes.
- Use the idea of a “minimal viable quest” from The Minimal Viable Quest: Tiny, Three-Choice Questas Formats That Still Deliver Big Insight as a guardrail.
Treat branches as hypotheses
Each branch is essentially: “If someone in this role chose X, this is what would likely happen.”
- Label branches internally with the assumption they represent.
- After people play, compare their paths and feedback to your expectations.
- Use that gap to refine your model of the system or user.
Use visuals with intent
In Questas, it’s easy to generate lots of images. To avoid visual noise:
- Define your visual tone up front. Is this investigative, hopeful, bureaucratic, speculative?
- Lock in a style board so characters and settings stay consistent. The workflow in From Moodboard to Mission: Using AI Style Boards to Lock In the Look of Your Next Questas World is a great starting point.
- Use micro‑video only at key emotional or conceptual beats—reveals, reversals, or turning points.
Design for accessibility and trust
When your work touches public issues or research participants, trust and access are non‑negotiable.
- Offer text alternatives for audio or video.
- Use clear, readable typography and high‑contrast visuals.
- Avoid manipulative framing. Make it clear when outcomes are speculative vs. directly supported by data.
- Be transparent about data use. If you’re logging choices, explain why and how.
For a deeper dive on inclusive design decisions, Accessibility-First Quest Design: Building Questas That Welcome Every Player offers a practical checklist.
Example Project Ideas to Kickstart Your Thinking
To make this concrete, here are a few starter ideas you could build in a week or less.
For research teams
-
Customer onboarding friction lab
Let stakeholders play through a first‑time setup from different persona perspectives, choosing responses to common friction points. Use their paths to prioritize fixes. -
Future product scenario pack
Build three short quests, each representing a different product strategy. Have teams “live in” each for a week and capture reflections.
For newsrooms
-
Local election explainer
A quest where readers play as a voter navigating different information sources, candidate promises, and ballot measures, seeing how their final choices shift based on what they encounter. -
Climate adaptation story
A branching narrative where readers guide a coastal town over 20 years, choosing between short‑term fixes and long‑term investments.
For civic designers and public agencies
-
Transit redesign walkthrough
Residents choose between service changes, fare models, and accessibility upgrades, then see how different personas experience the system. -
Youth advisory council simulator
Teens play through scenarios about school policy, public space, or online safety, surfacing their priorities in a format that’s more engaging than a survey.
Bringing It All Together
Interactive story tools like Questas aren’t just a new toy for narrative designers. They’re becoming a shared canvas where:
- Researchers turn insights into playable experiments.
- Journalists turn investigations into guided, explorable worlds.
- Civic designers turn abstract policies into lived, visualized futures.
The common thread is simple: when people can play through a system, they understand—and reveal—more than when they just read about it.
Your Next Step
You don’t have to rebuild your whole practice around branching narratives to start seeing value. Pick one small, high‑leverage moment and make it playable.
Here’s a concrete way to begin this week:
- Choose a decision that matters.
A policy vote, a product concept choice, a storyline in your reporting. - Outline 3–4 scenes around it.
Setup → decision → consequence → reflection. - Open Questas and build a tiny quest.
Use AI images sparingly but intentionally to humanize the stakes. - Share it with 3–5 trusted collaborators.
Ask them to play, then talk more about how they chose than what they chose. - Iterate once—and ship.
Use it in a workshop, a stakeholder meeting, a classroom, or a story package.
The first time someone says, “I never understood it this way before,” you’ll know you’re onto something.
Adventure awaits—not just for players, but for the way we research, report, and redesign the world together.